
Dr. Philip McMillan, John McMillan
Five years after the pandemic’s onset, a stubborn number refuses to budge. Excess mortality across much of the Western world remains elevated above its 2015 to 2019 baseline. The vaccinated, according to a growing body of research, appear protected. The unvaccinated, having largely acquired natural immunity through exposure, have stabilized at their expected mortality rates. The arithmetic, then, presents an uncomfortable question: if both groups are accounted for, who is still dying?
Dr. Philip McMillan, a researcher and clinician who runs the Vejon Health platform, believes the answer has been sitting in publicly available data since 2022. His recent reanalysis of Office for National Statistics mortality figures, stratified by vaccination dose count, points to a cohort that most safety studies have quietly excluded from their calculations: people who received only one vaccine dose.
A study that protects against car accidents
The question resurfaced with the publication of a modified self-controlled case series examining mortality risk in US Medicare beneficiaries aged 65 and older (Xu et al., 2024). The headline finding was reassuring: relative incidence of all mortality outcomes was significantly less than one in the first 28 days following the COVID-19 primary series. In plain terms, vaccinated older adults appeared to have a 63 to 67 percent lower risk of dying from any cause compared to their own baseline.
Any cause. Not just COVID. All-cause mortality, which includes heart attacks, strokes, falls, car accidents, and suicide.
Dr. McMillan’s response to this is blunt. “You can’t tell me that you vaccinate a cohort against COVID and they are protected from other causes of mortality, car accidents, falling out of trees, suicide, that makes no sense.” This was seen in a recent French study looking at the vaccinated cohort.
The problem is well recognized in epidemiology and carries a name: the healthy vaccinee effect. People who seek out vaccination tend to be healthier, more health-conscious, and more engaged with the medical system than those who do not. When a study compares their outcomes to a general baseline, the vaccinated group will almost always look better, not because the vaccine prevented non-COVID death, but because the comparison is structurally biased. A mortality ratio below one for all causes is not evidence of broad protection. It is evidence that the baseline is wrong.
The study’s 28-day observation window compounds the issue. Any signal that takes months or years to manifest falls outside the frame entirely. The camera is pointed at the wrong wall.
Four lines on a chart
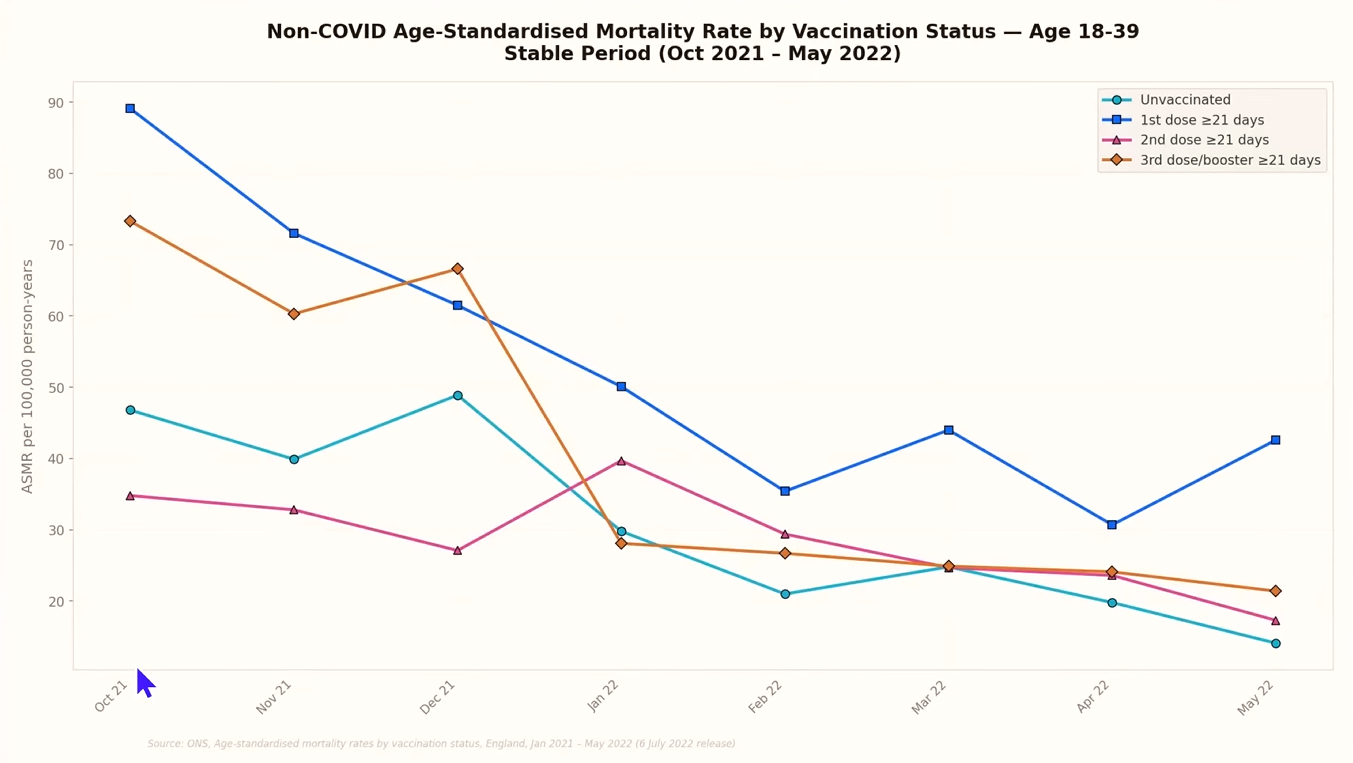
Dr. McMillan’s own analysis takes a different approach. Using ONS data from a stable period between October 2021 and May 2022, well beyond the chaotic initial rollout, he plotted age-standardized mortality rates for non-COVID deaths, broken down by vaccination status: unvaccinated, one dose only (beyond 21 days), two doses (beyond 21 days), and three doses (beyond 21 days). This data comes from the ONS series “Deaths by vaccination status, England,” which provides monthly age-standardized mortality rates stratified by dose count and age group.
The results, which he originally charted by hand in Excel in 2022 and recently reproduced using AI-assisted data visualization, tell a consistent story across age groups.
In the 70 to 79 cohort, the unvaccinated line sits at what Dr. McMillan considers the true baseline. The third-dose line tracks slightly below it, consistent with the healthy vaccinee effect, not genuine additional protection. But the single-dose and double-dose lines sit noticeably higher. The single-dose cohort, in particular, shows the highest age-standardized mortality rate of any group for non-COVID causes of death.
The pattern becomes more alarming in the 18 to 39 age group. These are young adults who, under normal circumstances, die at very low rates. The data shows a brief protective window of roughly one to three months for the double-dose cohort, after which every vaccinated group trends above the unvaccinated line for non-COVID mortality. Once again, the single-dose cohort sits at the top.
Young people, dying of causes unrelated to COVID, at rates exceeding their unvaccinated peers. The signal is hard to dismiss.
The one-dose question
Why would someone stop at a single dose? During the rollout period, the expectation was clear: dose one would be followed by dose two within three to four weeks. Dr. McMillan’s reasoning is straightforward. By October 2021, anyone still recorded as having only one dose was far beyond the expected return window. A small number may have simply declined to go back. But the more probable explanation for many in this group is that their first dose produced a reaction severe enough to discourage a second.
The medical establishment at the time offered a now-familiar reassurance: feeling unwell after vaccination was a sign the immune system was responding. Dr. McMillan sees this differently. A strong adverse reaction is not a badge of robust immunity. It is, potentially, a marker of hyperimmune response, an excessive activation of immune pathways that carries its own longer-term risks.
If this hypothesis holds, the single-dose cohort is not a random slice of the population. It is a self-selected group filtered by adverse reaction, and their elevated mortality may reflect the downstream consequences of that initial immune event.
The blind spot in study design
This is where the data gap becomes a structural problem. Most vaccine safety studies define their “vaccinated” cohort as those who completed the primary series, typically two doses. People with only one dose are classified as partially vaccinated and excluded from the analysis. They do not appear in the vaccinated column. They do not appear in the unvaccinated column. They exist in a statistical no-man’s-land, invisible to the very studies designed to detect harm.
“If they pick the wrong cohorts to do the studies on, they won’t see any signals,” Dr. McMillan observes. “But if you look carefully and if you know where to look, then all the signals are there.”
The exclusion is not conspiratorial. It follows standard epidemiological protocol. But the effect is the same: if the cohort most likely to have experienced adverse events is systematically removed from safety analyses, those analyses will consistently return clean results. The methodology is not lying. It is simply not looking in the right place. A recent peer-reviewed reanalysis of the same ONS dataset by Alessandria et al. (2025) reached similar conclusions about the anomalies visible when mortality is stratified by dose count.
A timeline problem
Dr. McMillan raises one further concern. The ONS charts show the double-dose line trending upward toward the single-dose line over time. If the trajectory continues, the two cohorts converge. His interpretation is that whatever biological process is affecting single-dose recipients may also be affecting those who received two or three doses, only on a longer timeline.
If that is correct, the problem does not shrink with time. It grows.
What needs to happen
The ask is not radical. It does not require anyone to abandon their position on vaccination. It requires matching adverse event records to long-term health outcomes: hospitalization data, disease incidence, mortality. The data exists. The linkage is technically feasible. The question is whether the institutions responsible for public health are willing to look.
Five years without clear answers is not a limitation of the science. It is a choice. And every month that passes without investigation is another month of data lost, another month of a potentially vulnerable cohort left without answers or support. The lines on the chart are still climbing. At some point, someone will have to read them.


0 Comments